Whether you're testing the viability of a new business idea, looking for fundraising or just simply wanting to better support your business decisions, our Business Plan Kit will help you save time.
Meet the Perfect Business Plan Kit
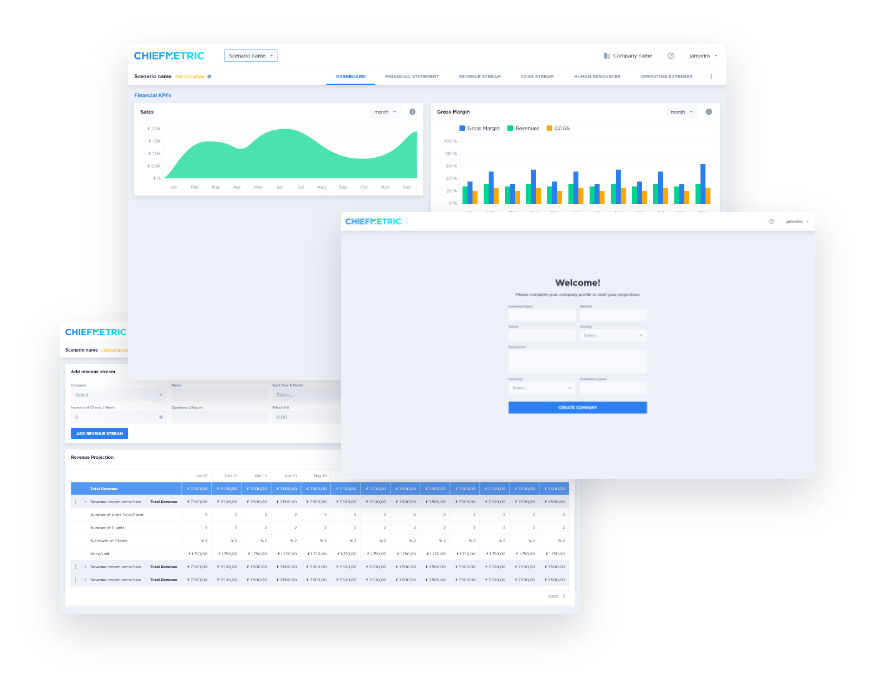
- Get a stunning company dashboard and your projected income statement in less than 24h.
- We'll do all the math for you, including key metrics like CAC or LTV.
- It includes a beautiful dashboard that automatically changes as you try different scenarios.
- Built and reviewed by humans - yes, us! - who've worked with hundreds of entrepreneurs.
- No need to worry about infinite errors hidden in cells - we'll give clear instructions on how to edit that model afterwards so you can easily try different scenarios as your strategy changes.
- And look at what our happy customers have to say about their experience working with us.
Check our Business Plan Kit 👇.
Financial Model Template for SaaS
Now, before we go much into details, let's remind you that this financial model template is the second out of a series of three, so this post will focus on explaining the main differences that apply for SaaS. For more context, please read our first financial model template for e-commerce/ physical goods or our financial projections for startups complete guide.
Contents
- Assumptions
- Revenue and Acquisition Funnel
- COGS and Operational Expenses
- Human Resources
- Financial Model
- Profit and Loss Statement
- Cashflow Statement (coming soon - subscribe to be notified)
- Balance Sheet (coming soon - subscribe to be notified)
Assumptions
As usual, apart from the color code you should bear in mind while making changes to this spreadsheet, this first tab includes the general business assumptions, or in other words, some basic characteristics that were taken into account when creating the overall structure of this template.
These assumptions are also why we've created our financial modeling tool for startups and SMEs, as depending on certain business decisions, the whole structure of the excel template changes, and that requires extra work apart from the scope of what we'll explain on this post.
In this particular case, this fictional company that we've made up just to use as an example starts operating in July 2021, has four digital acquisition channels with different costs of acquisition (CAC), and has two pricing plans available (just like us!).
Revenue and Acquisition Funnel
We must confess that SaaS is our favorite business model to build financial projections for. And for geeks like us, few things are more exciting than testing acquisition scenarios and understanding its impact on sales. This is the tab where you do precisely that.
Conversion Rates and Churn
Oversimplifying to facilitate the understanding of this example, we've started by including only two conversion rates: users who visit the website and convert into registered users ('Visitors > Registered Users') and registered users who convert into paying customers ('Registered Users > 'Paying Customers').
Monthly churn rate is also considered, meaning the rate at which paying customers stop subscribing to this company's pricing plans. If you have some difficulty understanding all this jargon, do take a look at these essential metrics and KPIs for startups (with examples).
Acquisition Channels and Customer Acquisition Cost (CAC)
You can then go on to making assumptions regarding the proportion of your digital acquisition channels, considering all the channels that resul in traffic to your SaaS business website, while considering different CACs for each of these channels. It is particularly interesting to test different scenarios at this point, as the proportion of acquisition channels you input and respective CACs will have a direct impact on your business gross margin.
A healthy acquisition funnel works around the right mix of cheaper and more expensive channels, as usually the cheaper ones may not bring enough traffic. In this example, of course it would be amazing if 100% of traffic was generated organically, through content, as its cost of acquisition is considerably lower. However, this more reactive approach based on active needs of potential customers may not be enough. For example, social media ads also allow you to target potential customers that may not necessarily be looking for your solution at the moment, therefore widening the scope of your funnel - usually at a higher cost, of course, as you'll have an extra job to convince these users that they need your services.
Growth and Pricing
The last bit to get your revenue projection is to make reasonable assumptions regarding growth rates and pricing. In this example, we've considered three growth rates: one that's applied for the first 6 months, a second one assuming growth for the subsequent 12 months, and a third one for each of the three last years included in this financial model. Also, as already mentioned, this company has two pricing plans, and it's assumed both are paid monthly.
COGS and Operational Expenses
The gross margin of SaaS business models usually benefits from simplified fees associated with the cost of sales, which in this case includes little more than payment fees.
On the other hand, its operational expenses may include more particular entries, such as expenses with hardware, software and technical services, as the ones exemplified in the document. Nevertheless, there are some expenses transversal to almost any business model, such as marketing expenses - here automatically calculated based on Acquisition Funnel metrics inputted on the previous tab.
Human Resources
This company is planning to operate with nine professional profiles: CEO, COO, Engineering Manager, Backend Developer, Frontend Developer, QA Analyst, Marketing Manager, Business Development Manager and Customer Service Agent.
For each of these professional categories, the number of employees may or may not evolve according to the company's evolution of paying customers. For example, for this financial model, it is considered that the CEO and COO are positions which will only be represented by 1 employee each throughout the five projected years. All the other positions, however, are assumed to have limit paying customers per employee. This limit depends on the position, and the hiring plan projected on this tab is calculated automatically according to these limits.
For example, the Customer Service Agent position is set to have a limit of 100 paying customers per employee. According to the Revenue evolution projected on a previous tab, the company will then have hired 11 customer service agents by the end of 2022.
The final table shows the evolution of Human Resource costs taking those hires into account, multiplying the employee headcount per position by its respective total cost, also considering a base salary annual growth of 2% for all employees.
Financial Model
With all the previously mentioned tabs completed and properly adapted to your business model, you will end up with a summarized financial projection view of your business in the form of a Profit and Loss Statement (see 'Business Model' tab).
Here you can also see an approximation of the investment needs for your company, meaning the money you will need to finance your unprofitable period - in the case there is one - until you finally start generating profit. In this financial model example, this company will need to raise around 350k to finance its first two years of operation, being its third operational year already generating a positive EBITDA of over 900k.
The Cashflow Statement and Balance Sheet that complete this Three Statement Financial Model template will be added soon, so if you're interested, please subscribe to be notified of updates on our financial model template!